

Quick Answer
A 20kW to 40kW DC wallbox charger is the most capital-efficient way to bring commercial-grade DC charging onto a small business site — provided you manage utilization. On pay-per-kWh revenue at 15% utilization, a 40kW unit typically pays back in about 2.0–2.7 years, a 30kW unit in 2.4–3.5 years, and a 20kW unit in 3.8–5.3 years, based on all-in installed cost and including OPEX and demand charges. For fleet managers, the business case is often stronger: depot charging at €0.25/kWh versus public DC rates of €0.55/kWh can save thousands per van per year, delivering payback in under two years. The five decisive levers are utilization rate, tariff structure, revenue model, installed cost, and OPEX — not the sticker price of the hardware.
Key Takeaways
- Payback windows of 2.0–3.5 years are realistic at 15% utilization with a $0.20/kWh gross margin; sites that fall below 8% utilization can stretch past five years or never break even.
- A 40kW wallbox adds roughly 100 km of range in about 30 minutes, versus ~60 minutes at 20kW — faster turnaround multiplies revenue per stall and fleet productivity.
- OCPP 1.6 compliance is non-negotiable for billing, load management, and time-of-use tariff optimization; non-compliant units cap your revenue upside.
- Dual-connector models (CCS2 + CHAdeMO) protect compatibility across modern European EVs and older Japanese-built vehicles, widening your addressable revenue base.
- Incentive programs (IRA 30C in the US, AFIR-linked grants in the EU, Workplace Charging Scheme in the UK) can cut 30–50% from installed cost and shorten payback by a year or more.
Why 2026 Changed the ROI Question for Charging Hardware
For most of the last decade, the buying decision for commercial EV charging was framed as a compliance question: “do we need charging on site, and what is the cheapest way to add it?” That era is over. By 2026, small business owners and fleet managers are asking a different question: “which charger pays for itself fastest?” Three forces drove this shift.
First, fleet electrification moved from pilots to scale**. Electric vans and light trucks are now the fastest-growing segment of EV sales, and every electrified vehicle creates a daily energy obligation that lands on the business’s balance sheet. Second, **energy price volatility turned charging from a fixed cost into a managed cost**. Businesses that can shift charging into low-tariff windows — and bill public users for energy they resell — treat charging as a profit center or a cost-avoidance engine rather than a line item. Third, **public charging prices rose to €0.50–0.70/kWh in many markets, making every kWh that a business generates for itself at €0.20–0.30 worth far more than the hardware that produces it.
The practical consequence: AC-only thinking no longer survives contact with a commercial duty cycle. A 7–22kW AC unit may be fine for overnight employee charging, but it cannot serve a fleet turnaround window, a pay-per-kWh retail session, or a dealership test-drive fleet. The 20–40kW DC wallbox class exists precisely because it closes that gap — at a price point and installation footprint that a small business can actually justify on paper.
What a 20–40kW DC Wallbox Actually Is (and Is Not)
A DC wallbox delivers direct current straight to the vehicle battery, bypassing the vehicle’s onboard charger entirely. This is the single most important technical distinction for ROI: an AC installation is throttled by the car’s onboard rectifier (typically 7–11kW even for nominally “22kW” AC units), while a DC unit is limited only by the battery’s charge acceptance and the unit’s own rating. In practice, a 20kW DC wallbox charges a typical fleet van two to three times faster than a 22kW AC unit, and a 40kW unit three to eight times faster than common AC infrastructure.
It is equally important to say what this class is not: it is not an ultra-fast 120–150kW charging hub. A DC wallbox runs on standard three-phase 400V input (roughly 29A per phase at 20kW, 43A at 30kW, and 58A at 40kW), requires no transformer or liquid-cooled cabling in most commercial sites, and is wall- or pillar-mounted with a footprint similar to an AC wallbox. That simplicity is precisely what makes the ROI math tractable: the equipment cost of a 30–40kW wallbox is typically 60–70% below a 120kW+ station, while still delivering three to four times the daily throughput of AC.
Three hardware features do the most work in the ROI model:
- Connector strategy. CCS2 is the standard for European and US-built EVs, but CHAdeMO remains common on Japanese-built models still circulating in many fleets. Dual-gun units such as the DC Wallbox CCS2 with CHAdeMO compatibility let one stall serve both connector populations — a meaningful revenue and utilization advantage on mixed-traffic sites.
- OCPP 1.6 protocol compliance. This is the software backbone of ROI: remote monitoring, user authentication, dynamic load management, and tariff-driven scheduling all depend on it. A charger without OCPP cannot participate in demand-response programs, cannot bill accurately, and cannot be tuned to your electricity tariff.
- Metering accuracy. Units with certified metering allow lawful pay-per-kWh billing, which converts a cost center into a revenue line.
The 20kW Class: Low-Cost Entry with a Clear Ceiling
A 20kW unit delivers roughly 18kWh of usable energy per hour (accounting for ~90% conversion efficiency). For a 40–60kWh battery, that means a full 10–80% session in roughly 1.5–2.5 hours. This class suits destination sites with long dwell times — a hotel, a car dealership, a restaurant — where the vehicle parks for hours anyway and the charger’s job is to convert parking time into energy sales at the lowest possible CAPEX. Its ceiling is equally clear: at 20kW, the average session produces only about 7–8 kWh per 30-minute window, which limits both throughput and revenue per stall on busy sites.
The 30kW Class: The Fleet and Workplace Sweet Spot
30kW is the power class where turnaround time finally fits a working day. A 60–80kWh fleet vehicle receives 180+ km of range per hour, so a 60–90 minute session covers a shift handover or lunch break. Most light commercial fleets — vans with 40–60kWh packs doing 150–250 km per day — never need more than this, and the lower input current (43A per phase) keeps electrical upgrade costs in check. For operators standardizing across depots and workplaces, a Wall Mounted DC Charging Station at 30kW with a single CCS2 gun and OCPP 1.6 management delivers the best speed-per-euro in the category.
The 40kW Class: Turnaround and Revenue Oriented
40kW compresses a 10–80% session on a 60kWh pack to roughly 60–75 minutes, and adds ~100 km of range in about 30 minutes. That speed has two direct ROI consequences: the same stall can serve 8–14 sessions per day instead of 4–7, and the shorter session time attracts drivers who would otherwise queue at public fast chargers. For fleets with tight dispatch windows — or retail sites selling energy at public-market rates — the extra kW pays for itself quickly. The trade-off is a higher demand-charge footprint and slightly higher equipment cost, which the ROI model in the next section quantifies.
The Five Variables That Drive DC Wallbox ROI
Every credible charger business case reduces to five variables. Change any one of them and the payback period moves by years — which is why identical hardware produces wildly different outcomes on different sites.
1. Utilization Rate — the Master Variable
Utilization is the share of a 24-hour day during which the charger is actively delivering energy. It is the single largest driver of ROI because it multiplies everything downstream: energy throughput, revenue, and cost recovery. Industry benchmarks used by charge-point operators consistently treat 15–20% utilization as the threshold for profitable public DC operation; below roughly 8%, the revenue model cannot cover fixed costs. The practical lesson for small businesses: before buying hardware, decide how many vehicles or customer sessions will actually use it per day, and build the case around that number — not around peak capacity.
2. Electricity Cost and Tariff Structure
The spread between what you pay for energy and what you recover is the heart of the model. A typical public session is priced at €0.45–0.60/kWh; commercial supply costs in 2026 commonly run €0.20–0.30/kWh, leaving a gross margin of roughly $0.20–0.30/kWh. Two tariff features can destroy or amplify that margin:
- Time-of-use (ToU) rates let a fleet schedule charging into off-peak windows, effectively widening the margin by €0.05–0.15/kWh. This is only possible with OCPP-based scheduling or built-in load management.
- Demand charges — billed on your highest 15-minute power draw — are the hidden killer. At $10/kW·month, a 40kW charger adds up to $4,800 per year of cost before it delivers a single kWh of revenue. Load management and staggered session starts are the standard mitigations.
3. Revenue Model: Pay-per-kWh vs. Internal Cost Avoidance
There are two distinct business cases, and mixing them up produces bad decisions. The revenue model** treats the charger as a profit center: you resell energy at public-market rates and earn the spread. The **cost-avoidance model treats the charger as infrastructure: you replace expensive public charging or diesel with cheaper on-site energy, and the “revenue” is the avoided cost. For fleets, cost avoidance is almost always the larger number — it applies to every kWh the fleet consumes, not just the sessions you can attract from outsiders.
4. Installed Cost (CAPEX) — Hardware Is Only Half the Story
Hardware prices for 20–40kW wallboxes range from roughly $4,000 to $10,000, but the all-in installed cost — electrical panel capacity, cable runs, trenching, mounting, commissioning, permits — typically lands 60–80% higher. A site with spare panel capacity and a short cable run can install at the low end of the range; a site needing a panel upgrade or a 30-meter trench can double the figure. Always model installed cost, never equipment cost alone.
5. OPEX — Software, Maintenance, and Network Fees
The annual cost of keeping a DC wallbox running typically totals $1,800–2,600: charging management software subscriptions ($600–900), preventive maintenance and repairs ($600–900), and network, insurance, and payment-processing fees ($400–800). These are small per year but compound across a 7–10 year service life, and they are the difference between a 2-year and a 4-year payback.
ROI Comparison: 20kW vs 30kW vs 40kW Side by Side
The table below consolidates the model into a single comparison. Assumptions: retail charging price of $0.45/kWh; blended supply cost of $0.25/kWh (gross margin $0.20/kWh); 90% conversion efficiency; demand charge of $10/kW·month; OPEX of $1,800–2,600/year scaling with power class; installed costs are mid-range commercial estimates including basic electrical work, excluding incentives. Utilization is the share of 24 hours with active charging.
tr>tr>tr>tr>tr>tr>tr>tr>tr>tr>tr>tr>
| Parameter (indicative) | 20 kW | 30 kW | 40 kW | ||
| Typical installed cost (hardware + electrical + commissioning) | $6,500–$9,000 | $8,500–$12,000 | $10,500–$14,000 | ||
| Time to add ~100 km of range (≈17 kWh/100 km) | ≈60 min | ≈40 min | ≈30 min | ||
| Realistic daily sessions (30-min average session) | 4–7 | 6–11 | 8–14 | ||
| Daily energy throughput @ 15% utilization | ≈65 kWh | ≈97 kWh | ≈130 kWh | ||
| Daily gross margin @ 15% utilization ($0.20/kWh spread) | ≈$13 | ≈$19 | ≈$26 | ||
| Annual OPEX including demand charges | ≈$4,200 | ≈$5,400 | ≈$6,600 | ||
| Est. annual net income @ 15% utilization | ≈$1,700 | ≈$3,500 | ≈$5,200 | ||
| Payback @ 15% utilization, no incentives | ≈3.8–5.3 yrs | ≈2.4–3.5 yrs | ≈2.0–2.7 yrs | ||
| Payback @ 25% utilization + 30% incentive + load management | ≈0.9–1.5 yrs | ≈0.8–1.2 yrs | ≈0.7–1.0 yrs | ||
| Payback risk below 8% utilization | 6+ yrs or negative | 6+ yrs or negative | 6+ yrs or negative | ||
| Best-fit deployment | Low-traffic retail, first pilot | Workplace + light fleet | Fleet depot, high-traffic retail |
Three conclusions jump out of this table. First, power class is a utilization decision**: if you cannot realistically exceed 10–15% utilization, a 20kW unit with low demand charges is the rational purchase; if you can sustain 20%+, the 40kW unit’s higher throughput wins decisively. Second, **demand charges and utilization dominate equipment price** — a $2,000 price difference between units is smaller than one year of demand-charge variance. Third, **incentives and load management are worth more than hardware discounts: the bottom row shows that combining a 30% capital incentive with demand-charge mitigation roughly halves the payback period versus the no-incentive case. For businesses standardizing across multiple sites, evaluating the full 20kw 30kw 40kw DC Charger range against site-specific utilization is the correct starting point.
Fleet Scenario: Depot Charging as Cost Avoidance
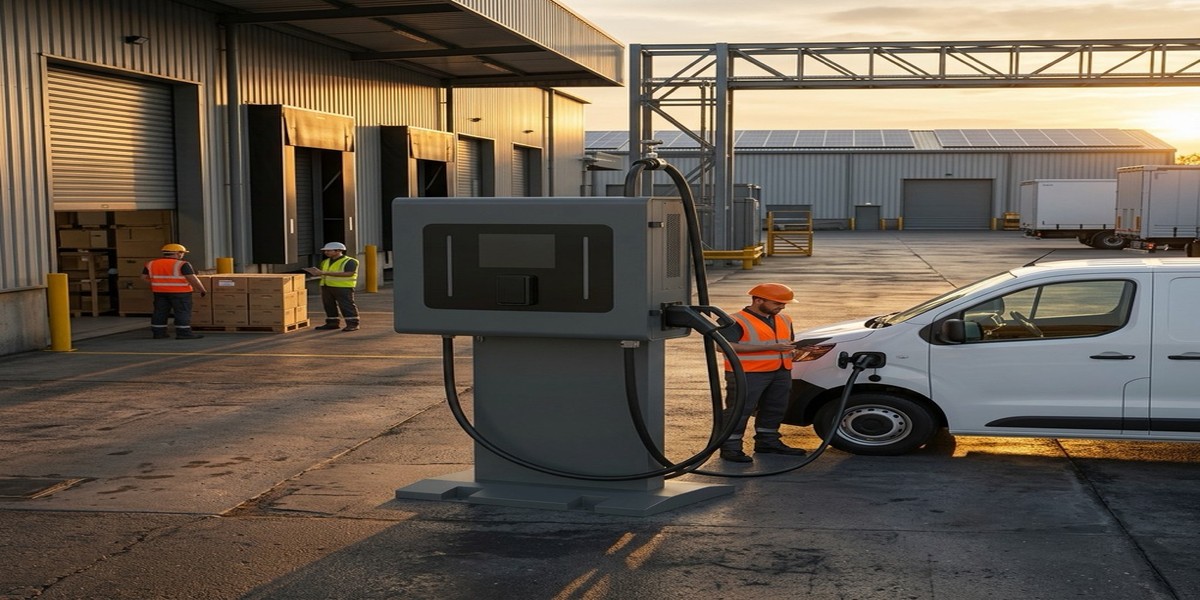
Consider a small delivery operator running six electric vans with 60kWh batteries on a 250 km daily duty cycle. Each van consumes roughly 45–50 kWh per day at a typical efficiency of 5–6 km/kWh. With a 40kW depot charger, each van needs about 75 minutes for a 10–80% session, so a single stall can comfortably serve three to four vans per day with staggered scheduling.
The cost-avoidance math is where the case is won. Charged exclusively at public DC rates of €0.55/kWh, each van costs about €27 per day in energy — roughly €6,900 per year. Charged on-site at a depot rate of €0.25/kWh (including network charges), each van costs about €12.50 per day — roughly €3,100 per year. For three vans per stall, that is a saving of about €11,400 per year per charger. Subtract annual OPEX of roughly €2,400, and the net saving of ~€9,000 per year against an installed cost of €11,500–13,000 produces a payback of about 1.3–1.5 years — without selling a single kWh to the public.
Two additional fleet-specific benefits strengthen the case further. Driver idle time collapses: a 75-minute depot session replaces 40 minutes of queuing and a 2+ hour public-charging detour, which is real labor cost on any route with hourly or per-drop remuneration. And predictable depot charging protects the fleet from public-tariff inflation, which has risen faster than supply costs in most European and North American markets since 2023.
Destination Business Scenario: Turning Parking into Revenue
For retailers, hotels, dealerships, and hospitality venues, the business case is different: the charger must earn its keep from energy sales and dwell-time conversion. Here the speed of DC matters because revenue is a function of sessions per stall per day, not kWh per session. A 30-minute session at a 40kW unit delivers about 18 kWh and, at a $0.20/kWh margin, about $3.60 of gross margin per session — but the stall can cycle 8–14 sessions per day versus 4–7 at 20kW. The fit matrix below summarizes how deployment profiles map to power classes.
tr>tr>tr>tr>tr>tr>tr>
| Deployment profile | 20 kW | 30 kW | 40 kW | ||
| Retail, hospitality, dealership (destination) | Low-cost entry | Balanced choice | High-traffic sites only | ||
| Workplace / employee charging | Good | Recommended | Overkill | ||
| Light fleet (vans, 40–60 kWh packs) | Marginal | Recommended | Tight-turnaround fleets | ||
| Medium fleet (60–100 kWh EVs) | Too slow | Adequate | Preferred | ||
| Public pay-per-kWh site | Acceptable | Good | Best revenue per stall | ||
| Typical charge window per vehicle | 2–4 hours | 1.5–3 hours | 1–2.5 hours |
For destination operators, the softer ROI factors matter as much as the energy spread. EV drivers actively filter for charging-enabled venues in navigation apps, and charging availability measurably lifts dwell time and basket value at retail and hospitality sites. A visible dual-gun DC Wallbox CCS2 at the entrance signals the capability, attracts a demographic with above-average spending, and hedges the site against connector fragmentation — while the pay-per-kWh tariff ensures the energy itself is not given away.
Hidden Costs and Risks That Break ROI
Any honest ROI evaluation must confront the costs that do not appear on the equipment invoice:
- Demand charges. As modeled above, $10/kW·month turns a 40kW unit into a $4,800/year fixed cost. Mitigations: load management across multiple units, session staggering, battery-buffered charging, or tariff classes that exempt low-utilization charging.
- Electrical upgrades. Panel capacity, service upgrades, trenching, and permits routinely add 30–80% to hardware cost. Get a qualified electrical contractor’s quote before committing to a power class.
- Software lock-in. Chargers tied to proprietary management platforms limit tariff optimization, load management, and future CPO aggregation. OCPP 1.6 compliance is the escape hatch.
- Maintenance and reliability. Public-facing units take abuse: cable wear, connector damage, vandalism. Factor 0.5–1.5% of installed cost per year into OPEX, and check warranty terms on the charging module — the most failure-prone component.
- Non-OCPP or non-certified metering units cannot legally bill per kWh in most jurisdictions, silently converting a revenue asset into a free-charging liability.
None of these risks are disqualifying — but each one can move payback by 12–24 months if ignored.
Incentives and Financing That Shorten Payback
Capital incentives are the fastest legitimate way to compress payback, and the 20–40kW class is the sweet spot for most programs because installed costs are low enough to qualify under per-site caps:
- United States. The federal 30C commercial credit covers 30% of installed cost up to $100,000 per property for qualifying businesses; many states and utilities add make-ready grants covering panel and service upgrades, and NEVI corridor funding favors DC equipment in the 50kW class and above.
- European Union. AFIR-driven national programs and local grant schemes across member states commonly cover 30–50% of hardware and installation for small and medium enterprises, with priority for shared or fleet-use infrastructure.
- United Kingdom. The Workplace Charging Scheme and related commercial grants contribute a meaningful share of hardware and installation cost for eligible businesses; regional top-up schemes are common.
Program eligibility, caps, and expiry dates vary by region and change frequently — verify current terms before finalizing the business case. As a rule of thumb, a 30% incentive applied to the installed-cost column of the ROI table shortens payback by roughly a third; combined with load management, the effect is closer to a half.
Decision Checklist: 20kW, 30kW, or 40kW?
Use this checklist to convert the analysis into a procurement decision:
- Count your daily sessions. Fewer than 4 vehicles or customers per day → start with 20kW and revisit at scale. 4–8 per day → 30kW. More than 8, or dispatch windows under 90 minutes → 40kW.
- Audit your electrical capacity first. If a service upgrade is required, the incremental cost of a larger unit shrinks relative to the fixed upgrade cost.
- Check your tariff’s demand charge. Above $10/kW·month, favor 20–30kW or invest in load management before buying 40kW.
- Confirm OCPP 1.6 and certified metering on any shortlisted unit — these two features gate revenue and tariff optimization.
- Match connectors to your vehicle population. CCS2-only sites are fine for new fleets; mixed or public sites should consider dual-gun models.
- Stack incentives before you budget. Apply grants and utility rebates to installed cost, not hardware cost, and re-run the payback with the net figure.
- Standardize on one platform. For multi-site operations, a uniform Wall Mounted DC Charging Station lineup with shared OCPP management lowers per-site software and training costs.
The pattern across all seven steps is consistent: ROI is decided by utilization, tariff structure, and installed cost — and the 20–40kW DC wallbox class is the only segment where a small business can control all three without taking on utility-scale complexity.
Frequently Asked Questions
1. How long does a 20–40kW DC wallbox take to charge a typical electric van?
For a 60kWh van charging from 10% to 80% (about 42 kWh delivered), expect roughly 2.5 hours at 20kW, 1.5–1.7 hours at 30kW, and 1.2–1.3 hours at 40kW, including taper. A 100 km top-up takes about 60 minutes at 20kW, 40 minutes at 30kW, and 30 minutes at 40kW.
2. What utilization rate do I need to break even?
Industry benchmarks place the profitability threshold for public DC charging at roughly 15–20% utilization. Below about 8% (under 2 hours of active charging per day), fixed costs — demand charges, software, maintenance — typically exceed revenue, and a fleet cost-avoidance case becomes the more defensible model.
3. Can one charger serve both CCS2 and CHAdeMO vehicles?
Yes. Dual-gun units combine a CCS2 connector with a CHAdeMO connector on the same cabinet, letting one stall serve modern European EVs and older Japanese-built models. On mixed public or mixed-fleet sites, this can raise utilization by 10–20% versus a CCS2-only unit.
4. Do I need a three-phase supply or a transformer for a 20–40kW DC wallbox?
These units run on standard three-phase 400V input — roughly 29A per phase at 20kW, 43A at 30kW, and 58A at 40kW — which most commercial panel boards can accommodate without a transformer. The main electrical risk is existing panel capacity, not voltage class; have a contractor verify spare capacity before purchase.
5. What is OCPP, and why does it matter for ROI?
OCPP (Open Charge Point Protocol) is the standard that lets a charger talk to any management platform. OCPP 1.6 compliance enables remote monitoring, user authentication, dynamic load management, and tariff-scheduled charging — the three features that directly widen your energy margin and cap demand charges. Non-compliant units lock you into one vendor’s software and cap revenue upside.
6. Are there government grants that cover part of the cost?
Yes. In the US, the federal 30C credit covers 30% of installed cost for qualifying businesses, with state and utility make-ready programs on top. In the EU, AFIR-linked national schemes commonly cover 30–50% of hardware and installation for SMEs. In the UK, the Workplace Charging Scheme and commercial grants contribute a meaningful share. Eligibility and caps change frequently — verify current terms in your region before budgeting.
7. For a small fleet of 5–10 vans, should we buy 20kW, 30kW, or 40kW units?
For vans with 40–60kWh packs, 30kW is the recommended baseline: it restores 180+ km per hour and fits a shift-break window with the lowest demand-charge footprint. Step up to 40kW if dispatch windows are under 90 minutes, if sessions must be shared with the public, or if you want one stall to cover three to four vans per day. Choose 20kW only as a low-utilization pilot.
Post time: Aug-21-2026